

The Canadian Paradox: How Prosperity Created Its Own Constraints
Canada's Economy - Explained

Stand at the Canada-U.S. border on any given day and you’ll witness a peculiar economic phenomenon: 400,000 people crossing, $2.4 billion in goods flowing back and forth, an invisible economic bloodline connecting two nations so intimately that their fates seem inextricably bound. Yet this is just one contradiction in a country defined by them.
Canada is the world’s second-largest country by area, 9.98 million square kilometers of forests, tundra, prairies, and mountains. But 90% of its 42 million people huddle within 160 kilometers of the U.S. border, leaving vast territories rich with resources but hostile to human settlement. It’s a country that holds the world’s third-largest oil reserves yet struggles with boom-bust volatility. A nation that welcomes hundreds of thousands of immigrants annually to fuel growth, then throttles back when infrastructure buckles under the pressure. An economy that produces world-class AI research but watches its best minds and companies flee south for bigger paychecks and venture capital.
With a GDP of $2.3 trillion supporting 42 million people, Canada achieves a GDP per capita of $54,760, among the world’s wealthiest. Yet this prosperity masks fundamental tensions that will define its economic future: between resource dependence and diversification, between immigration growth and livability, between research excellence and commercial scale, between U.S. integration and strategic autonomy.
This is the story of how Canada’s advantages became its constraints.
Geography and Resources: The Wealth Trap
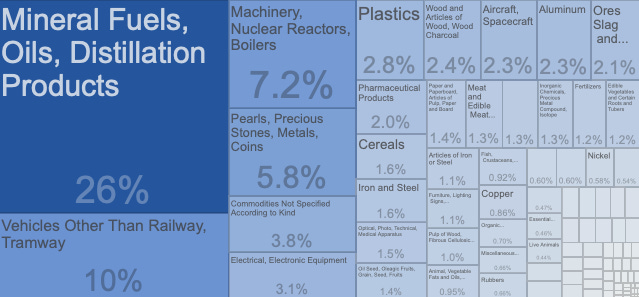
The numbers tell a strange story. Canada produces 4.9 million barrels of oil per day from reserves of 166 billion barrels, the world’s third-largest. In 2024, natural resources generated $381 billion in exports, 54% of all merchandise exports, contributing 21% to GDP. Energy alone brought in $169 billion. For a country of 42 million, that’s extraordinary wealth.
But here’s the catch: Canadian oil sands require massive energy inputs to extract, yielding just 3-5 units of energy for every unit invested, compared to 20+ for conventional oil. Production costs run $20-40 per barrel, making Canadian oil vulnerable to every price swing. When oil crashed from $105 to $26 per barrel between 2014 and 2016, Alberta’s economy contracted 1.1%, 110,000 jobs vanished, and Ottawa had to inject $14 billion in stabilization funding.
The Canadian dollar moves in lockstep with oil prices, economists measure the correlation at 0.7. When oil soars, the “loonie” strengthens, making Canadian exports expensive and manufacturing uncompetitive. When oil crashes, the currency collapses, household purchasing power evaporates, and fiscal revenues crater. It’s a macroeconomic rollercoaster that no amount of fiscal prudence can fully smooth out.
Saskatchewan’s potash tells a similar story. The province sits on 50% of the world’s reserves, producing 14 million tonnes annually worth $7.6 billion, 32% of global supply. That’s enormous market power, until China decides to weaponize trade relationships. In 2018, after Canada arrested a Huawei executive at U.S. request, China blocked $2.7 billion in canola exports and crashed prices 40% overnight. Resource wealth cuts both ways.
Even agriculture, where Canada ranks second globally in wheat exports and first in canola, faces climate whiplash. Growing seasons have extended 10-15 days since 1950 as temperatures rise, enabling northern expansion. But the 2021 prairie drought, the worst in 60 years, slashed wheat production 38% and cost $6 billion. Climate change giveth and taketh away.
The deeper problem isn’t just volatility, it’s that resource wealth can become a trap. When commodities boom, labor and capital flow into extraction, wages rise, the currency strengthens, and suddenly manufacturing can’t compete. Economists call it Dutch Disease, and Canada has wrestled with it for decades. Resource revenues now represent 21% of GDP, up from 18% in 2000, even as politicians promise economic diversification. The resource sector isn’t shrinking, it’s growing.
Demographics: The Immigration Calculus
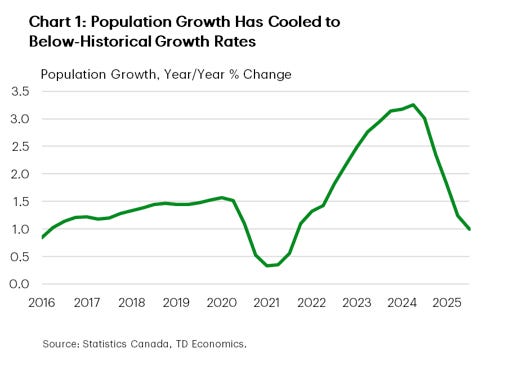
In 2023, Canada’s population grew 3.2%, the fastest among G7 nations and the fastest in Canadian history since the 1950s. International migration accounted for 97.6% of that growth. Without immigration, Canada’s population would be shrinking. Births minus deaths contributed just 2.4% of growth. By Q2 2025, immigration’s share had “dropped” to 71.8%, still extraordinarily high by any global standard.
The math is brutal and simple. Canada’s median age is 41.9 years. The old-age dependency ratio, people over 65 divided by working-age population, hit 28.9 in 2023, up from 14.4 in 2000, headed toward 42.4 by 2050. Healthcare spending must rise from 8.1% of GDP today to 11.2% by 2050. Old Age Security and related programs will jump from $72 billion (2.7% of GDP) to $160 billion (4.1% of GDP) by 2040.
Without sustained immigration of 300,000-400,000 people annually, Canada’s labor force begins absolute decline around 2030. Growth slows from 1.2% annually now to 0.4% by 2040. Potential GDP growth, the economy’s speed limit, falls below 1.5%. Tax revenues can’t keep pace with aging costs. The social contract breaks.
So Canada opened the doors wide. In 2024, it admitted 485,000 permanent residents. Temporary residents, students and workers, swelled to 6.5% of the population, roughly 2.7 million people. The foreign-born population reached 23.0%, the highest among G7 nations, approaching levels last seen when western expansion required mass immigration in the early 20th century.
Then reality hit. Housing construction averaged 240,000 units annually from 2020-2024. Population grew by 1.2-1.3 million people annually in 2022-2023. The math didn’t work. Median home prices surged 68% from $480,000 in 2019 to $807,000 in 2024. Rental vacancy rates collapsed to 1.5% in major cities, historic lows. Millennials and Gen Z found themselves priced out. Recent immigrants, who the system theoretically welcomed, couldn’t find affordable housing.
The political backlash came swift. In October 2024, the federal government slashed targets: 395,000 permanent residents for 2025, dropping to 365,000 by 2027. Temporary residents would be capped, aiming to reduce their share from 6.5% to 5% of population by 2027, roughly 600,000 fewer people. Growth decelerated from 3.2% to 0.9% almost overnight.
Here’s the contradiction: Canada needs immigration for long-term economic survival. Every study shows 1% population growth through immigration generates 0.8-1.0% GDP growth over five years, $24-30 billion annually. Immigrants fill labor shortages, start businesses, and support aging demographics. But Canada can’t build housing, transit, or healthcare capacity fast enough to make immigration politically sustainable.
And the consequences of cutting immigration are severe. Labor force growth slows. GDP growth slows. Tax revenue growth slows. Meanwhile, healthcare and pension costs accelerate. The Parliamentary Budget Officer’s projections show widening deficits stretching to the 2040s. Canada faces a choice between two bad options: continue high immigration and face infrastructure crisis, or cut immigration and face fiscal crisis. There’s no easy answer.
The Real Estate Economy
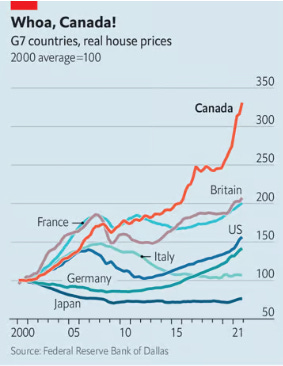
Here’s a statistic that reveals everything about modern Canada: real estate and construction combined represent 22.0% of GDP, $506 billion in 2024. That’s larger than manufacturing (10%) or the entire natural resource sector (11%). In 2000, real estate and construction were 15.2% of GDP. That 6.8 percentage point increase over 24 years represents the financialization of the Canadian economy.
Look at household balance sheets and the picture gets clearer. Residential real estate represents 49.8% of total household assets, $8.7 trillion of $17.5 trillion. After subtracting mortgage debt of $2.1 trillion, net residential equity accounts for 45.2% of household net worth. Nearly half of Canadian wealth is locked in houses.
Toronto and Vancouver tell the extreme version of this story. Benchmark home prices hit $1.15 million in Toronto, $1.23 million in Vancouver, compared to $396,000 in Montreal and $329,000 in Edmonton. That’s a 3.5:1 ratio between highest and lowest major markets, far exceeding the 2.0-2.5:1 typical in other developed economies. Young professionals in Toronto and Vancouver face a stark choice: inherit wealth, earn extraordinary incomes, or abandon homeownership dreams.
This creates profound macroeconomic vulnerability. If housing prices fell just 10%, household net worth would drop $870 billion, 38% of GDP. Mortgage debt service ratios reached 14.8% of disposable income in 2024, approaching the 15% threshold that historically preceded recessions. Consumer spending, which represents 57% of GDP, depends on the wealth effect from rising home values. Bank balance sheets hold mortgage portfolios representing 60-70% of assets. Municipal governments fund 15-20% of budgets through property transfer taxes and development charges.
The entire economy has become a leveraged bet on perpetually rising home values. Yet the fundamentals have diverged from reality. Housing prices rose 68% from 2019-2024 while wages grew 18%. The median home price-to-income ratio hit 9.2 in Toronto, 12.8 in Vancouver, compared to 3.5 considered “affordable.” Simple math suggests this can’t continue indefinitely.
But what happens when it ends? A housing crash wouldn’t just hurt homeowners, it would cascade through the entire economy. Consumer spending would collapse as wealth effects reverse. Bank balance sheets would deteriorate, potentially requiring government intervention. Construction, which employs 1.5 million people (7.7% of employment), would crater. Government revenues from property-related taxes would evaporate just as spending needs increase to support unemployed construction workers and struggling homeowners.
Canada has built an economy on real estate, and real estate has built a vulnerability that dwarfs any resource price shock or trade disruption. This trend is clearly not sustainable. The question is how it unwinds, and whether policy can manage a soft landing or whether market forces will impose a hard correction.
Trade: The Dependence Dilemma
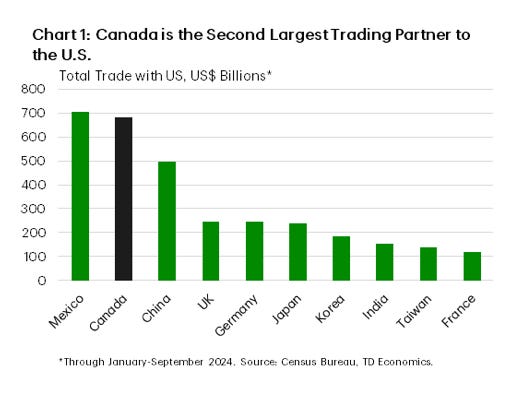
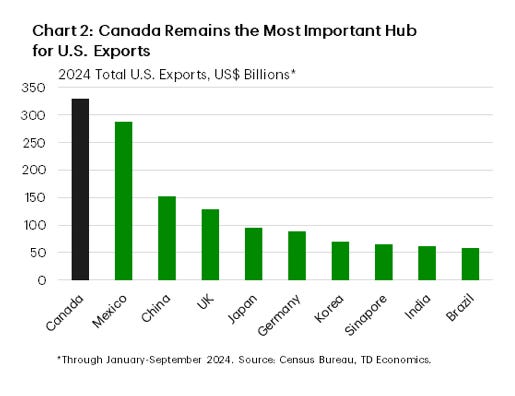
Every day, $2.4 billion in goods crosses the Canada-U.S. border. The United States absorbs 75.7% of Canadian exports, $550 billion of $726 billion total in 2024. Total trade (exports plus imports) represents 71.3% of Canadian GDP, making it one of the most trade-dependent developed economies.
This isn’t just proximity, it’s integration. Automotive parts cross the border 6-8 times during production. Canada exports 4.5 million barrels of oil daily to U.S. refineries while importing 0.6 million barrels of refined products because it lacks refining capacity. The Great Lakes-St. Lawrence Seaway carries $45 billion in cargo annually. Cross-border supply chains make “Canadian” and “American” manufacturing meaningless distinctions.
USMCA, which replaced NAFTA, governs 76% of Canadian trade. Economic studies estimate it adds $7-14 billion annually to GDP. But here’s the vulnerability: the agreement includes a six-year sunset clause requiring renegotiation. The first review comes in 2026. Every six years, Canada must convince whoever occupies the White House and controls Congress that maintaining trade access serves American interests. Policy uncertainty makes long-term investment, the kind that takes 10-15 years to pay off, extraordinarily difficult.
China represents the second-largest trading partner, but the relationship reveals uncomfortable asymmetries. Canada exported $31 billion to China in 2024 (4.3% of total exports) while importing $98 billion (10.8% of imports), a $67 billion deficit contrasting with a $33 billion surplus with the United States.
Worse, the export composition shows Canada’s role: resources out, manufactured goods in. Canola ($3.2 billion), wood pulp ($2.8 billion), ores ($4.1 billion), coal ($1.9 billion), potash ($1.4 billion), primary products represent 56% of exports to China versus just 28% to the United States. Meanwhile, Canada imports electronics ($24 billion), machinery ($18 billion), textiles ($11 billion), furniture ($8 billion). China manufactures; Canada extracts. The 2018-2019 canola dispute showed how vulnerable this makes Canada to political pressure.
Canada has signed comprehensive trade agreements with the EU (CETA), 10 Asia-Pacific nations (CPTPP), and South Korea. Combined, these agreements cover markets with 1 billion people and $30 trillion in GDP. Yet results remain modest: CPTPP nations account for 5.0% of exports, the EU 7.0%, South Korea 0.7%. Together, just 12.7% of exports.
Why? Geography is destiny in trade. Distance increases shipping costs 3-5 times for Asian markets. Time zones complicate communications and coordination. Different regulatory standards require costly product adaptations. Established relationships and trust networks favor existing partners. These structural barriers suggest limits to diversification despite policy efforts.
Canada faces an uncomfortable reality: prosperity depends on U.S. market access, which depends on U.S. political decisions over which Canada has minimal influence. That’s the definition of strategic vulnerability.
Innovation: The Scale-Up Problem
Canadian AI researchers pioneered deep learning. Geoffrey Hinton’s work in the 2000s laid foundations for modern AI. Yoshua Bengio advanced generative models and attention mechanisms. Richard Sutton developed reinforcement learning theory. Vector Institute in Toronto, Mila in Montreal, and Amii in Edmonton rank among the world’s leading AI research centers.
The numbers confirm this excellence. Canadian AI researchers accumulated 147,000 citations in 2023, ranking fourth globally. Canada produces 3.2% of global AI publications despite representing just 0.5% of global population—6.4 times overrepresentation. The federal government committed $2.4 billion through the Pan-Canadian AI Strategy, representing $57 per capita annually versus $28 in the United States.
Yet commercial translation tells a different story. Canada hosts 850 AI companies employing 42,000 people generating $9.2 billion revenue in 2024. That’s not nothing, but it’s far from dominance. An estimated 30-40% of Canadian AI PhD graduates take U.S. positions offering 2-3x salary premiums. Promising startups get acquired before reaching scale: Element AI sold to ServiceNow for $500 million, Layer 6 to TD Bank, Kindred to Ocado.
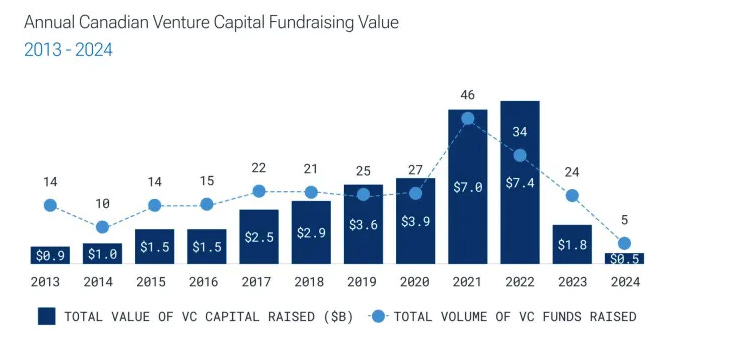
The venture capital gap explains much of this. Canadian AI companies raised $3.8 billion in 2024; U.S. AI companies raised $67 billion, 18 times more. Later-stage funding shows even starker disparities: $420 million raised in Canada versus $38 billion in the United States. Companies seeking growth capital face a choice: relocate headquarters south or accept acquisition.
This pattern extends beyond AI. Canada has 26 “unicorn” companies valued over $1 billion. The United States has 650+. Given population ratios, Canada should have 65-80 unicorns. It has one-third that number. Shopify, worth $184 billion, demonstrates Canada can build global tech champions, but Shopify remains the exception. The next-largest Canadian tech company reaches just $8.3 billion market cap.
Overall R&D spending reveals the constraint. Canada invests 1.54% of GDP in R&D, ranking 28th among OECD countries. This trails Israel (5.71%), South Korea (4.93%), Switzerland (3.37%), United States (3.47%), and Germany (3.13%). Canada’s R&D intensity has actually declined from 2.05% in 2001.
The technology sector employs 1.46 million people (7.5% of employment) and contributes 6.0% of GDP. It’s growing faster than the overall economy, 5.8% annually versus 2.3%. But scale remains limited compared to leading tech economies where technology represents 9.3% of GDP (United States), 7.8% (Israel), or 7.2% (South Korea).
Canada produces world-class research. It trains exceptional talent. It has supportive government policies. Yet it struggles to capture the economic value. The best researchers leave. The best companies get acquired or relocate. Capital flows south. A smaller domestic market, risk-averse capital, and brain drain create a structural disadvantage that policy has yet to overcome.
Managing Contradictions
Canada’s economic story is one of contradictions to be managed. Resource wealth generates prosperity but creates volatility and dependence. Immigration drives growth but strains infrastructure beyond political tolerance. Real estate concentrates household wealth but creates systemic vulnerability. Trade integration with the United States enables prosperity but surrenders strategic autonomy. Research excellence produces breakthroughs but struggles with commercial scale.
With GDP per capita exceeding $54,000, unemployment at 5.8%, stable democratic institutions, and high quality of life, Canada’s prosperity remains substantial. But the next chapter requires navigating tensions without easy resolutions: decarbonizing energy exports while maintaining fiscal revenue, sustaining immigration while building infrastructure capacity, managing housing markets without triggering financial crisis, maintaining U.S. trade access while building strategic autonomy, and translating research excellence into commercial success.
The data suggests these aren’t temporary challenges but permanent features of Canada’s economic geography, demography, and structure. Success lies not in resolving contradictions but in managing them—the perpetual condition of a prosperous middle power navigating constraints in an increasingly turbulent global economy.
Fascinating take on Canada's economy. As you accurately captured in the end, the fate of the country is one of a middle power: prosperous, but always second to its next door neighbour. But that does not limit the economic power it wields on the global stage, especially when it comes to its talent output in AI.